Region defined by an inequality
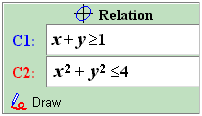
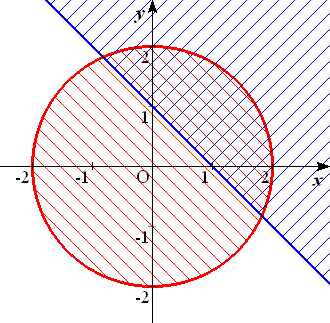
GRAPES draws the region defined by inequalities.

-
Input the expression as usual, for ">=" and "=<", input from the keyboard.
For the graph of relation

-
By connecting both sides of expression with "=", the boundary is drawn.
-
By connecting both sides of expression with ">" or "<", the interior region is drawn. You can select whether the boundary is shown or not in the Properties window of relation (in this case, the boundary is drawn in light color).
-
By connecting both sides of expression with ">=" (input ">=") or "<=" (input "<="), the boundary and the interior region are drawn.
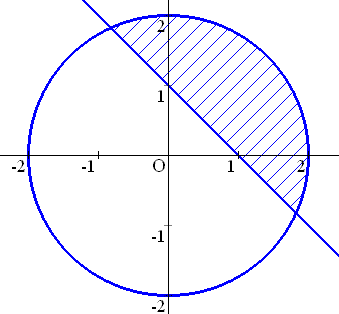
 To display the intersection of regions,
- Put each inequality in a parenthesis and then "and" the parentheses as necessary.
- The expression like f (x) < y < g (x) is also available.

- Example 1: the intersection region of x + y > 1 and x2 + y2 < 4,
write
- (x + y > 1) and (x2 + y2 < 4)
- Example 1: the intersection region of x < y and y < x2 + 1, write
- (x < y) and (y < x2 + 1)
- or
- x < y < x2 + 1
- Attention: "or" is not available, neither the nesting of parentheses (parentheses in parentheses).


 To display the intersection of regions,