Graph of polar equation

Drawing the graph of a polar equation
We deal with a folium r = sin (nθ) as an example.
- At first, select an object P (others are also available) in the Curve Area and also select the polar function as a function type.
- Input "r = sin nθ".
To input "θ" on the calculator, input "@".
- Set the increment.
This determines how "dotted" the graph will look like on the screen.
- Set the range if you wish.
- Set the color and the thickness of curve and point.
- Click [OK]

Negative radius
In the polar equation r = f (θ), the radius r
can sometimes be negative. In that case, we can preceed in two ways:
- There is no such a point;
- Take (r, θ), r < 0, to be (-r, θ + π).
GRAPES adopts the second way by default. But you can modify the setting as necessary.
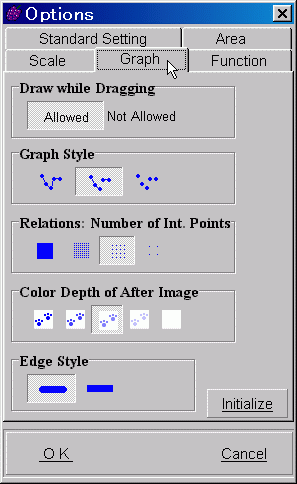
To modify it, on the Data panel [Option | Graph Options] or in the [Option] on the [Graph] palette, set [Not Allowed] at [Negative Radius].

Drawing the graph of an relation with r and θ
- By inputting an relation with an expression using r and θ, you can draw the graph of the polar equation.
- You can use x and y in an expression at the same time.
- Because the parameter θ is dealt with as
an argument in the relation, θ in the relation cannot be substituted by a value.
- The graph will not be sometimes correctly drawn, if the funcion has discontinuities.
[The hot skinny of GRAPES]
r = Sqrt (x2 + x2), θ = arg (x, y).
"arg" is a function which gives an argument and takes a value from 0 to 2π or
from -π to π. Because of this, when a point (x, y) moves across the x axis, the value of arg (x, y) changes discontinously and the graph of function will not be sometimes correctly drawn.


