Input and edit relation (equation / inequality)
A relation is an expression of the form f (x, y) = 0, f (x, y) >= 0. Also it can be two or more expression of this type connected with AND.
New relation 
- Click the button [Draw] in the Relation area on the Data Panel.
- The calculator will appear. Input the expression and decide its color and thickness.
Edit and Delete
- In the Relation area, click the expression you want to edit or delete.
- The Properties window will appear, and you can start editting.
Input expression or value
- Input an expression using x and y with the calculator.
- In the relation, r and θ, the elements of polar equation, are available.
In this case, r = Sqrt (x2 + y2), θ = arg (x, y).
x and y are compatible with r and θ.
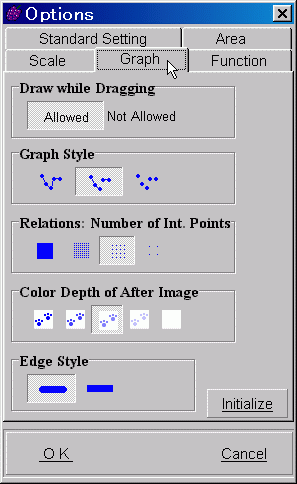
- If you want to use θ in the relation as a parameter like a or b, you can configure in the [Graph Options].
Properties of the graph style 
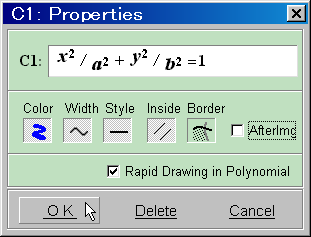
- After inputting an expression, it will be displayed in the Properties window of relation. Decide the graph color, the thickness, and On/Off of after image, and click [OK].
- In the case of the inequality, the region defined by the expressions is displayed. You can select a pattern to fill the region. Also select whether you display the boundary of region in a light color (even if the boundary is not displayed).
- To modify color or thickness, select from menu appeared by pointing a image of each part with cursor.
- To edit expression of relation at this moment, click the expression part.
With this operation, the graph of the relation will be drawn. If the expression contains some parameters, the graph will move as the parameter changes.
Supplement
-
Rapid drawing of conic and other polynomial
-
An expression represented as a polynomial of degree up to 6 in x and y can be drawn quickly by Lagrange's interpolation method basing the values of 49 points inside of the drawing area.
- The graph of a conic is drawn by solving an equation.
- The application of a discontinuous function would sometimes produce an incorrect graph.
- For the drawing of the graph of the general relation, GRAPES finds the zero points where the sign changes.
Therefore, if the expression contains a function which behaves discontinuously, an incorrect graph will be sometimes drawn.
- To know whether the degree of a polynomial is up to 7, GRAPES analyzes by comparing the values obtained from Lagrange's interpolation and the actual function value. It is same for the conics.
Therefore, GRAPES may give incorrect results for relations such as discontinuous function.
In the case of the strange results, remove the check from the checkbox [Rapid drawing in polynomial].
- Number of interpolation points for the graph of relation
 GRAPES analyzes function values at all the points on the screen to draw the graph of relation.
Because of this, the function which doesn't allow to use [Rapid drawing in polynomial] takes much time. To avoid this problem, GRAPES can scan not all of the points on the screen but some of them and apply the interpolation method.
In this case, the graph will be a little rough but you can gain some calculation time.
You can select one from the following four levels:
- Scan all points.
- Scan every other dot.
- Scan every 4 dots.
- Scan every 8 dots.
- [Relations: Number of Int. Points] can be configured in the [Graph Options] window.


 GRAPES analyzes function values at all the points on the screen to draw the graph of relation.
Because of this, the function which doesn't allow to use [Rapid drawing in polynomial] takes much time. To avoid this problem, GRAPES can scan not all of the points on the screen but some of them and apply the interpolation method.
In this case, the graph will be a little rough but you can gain some calculation time.