Line & Polygon : Connectting Objects
By connecting points of elementary objects or curves, you can construct line graph and polygon. You can also construct horizontal and vertical lines, that is, perpendicular line to x-axis or y-axis.
"Connect points" mode 

- Click the button "Connect Points" on the Tool Bar of the Data Panel
 .
.
Now, the cursor on the Graph window is in the mode of "Cconnect points".
- To cancel this mode, reclick this button, or click one of the "Zoom in" button, the "Zoom out" button, or the "Move" button in the Graph window.
Dragging by mouse
- When putting the cursor at the center of a circle or on a point, the cursor changes to the pencil form.
- Then, left click and drag to another object (point, coordinate axes, or elementary object). When the point color is changed,
drop there.

Properties
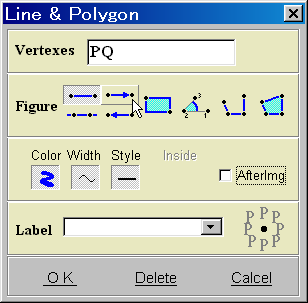
- You can modify the line style (segment, line, line with an arrow, rectangle), the color, the thickness, and the after image in the Properties window which will be displayed.
- In the case of the rectangle, also indicate a color of interior part.
- To show a label on the segment, input it in the text box and select the position at the right part of text box.
Modification and delete of the properties
To display the Properties of segment, the following two ways are available.

- By clicking
 on the tool bar, display the Line & Polygon Area and click the segment you want to modify or delete.
- Put the cursor on the segment, and select the "Line & Polygon Properties" by right clicking.
Drawing polygon and line graph
Indicating three or more points as vertices, you can draw angle, polygon, and line graph.
- Connect two vertices you want to draw (like drawing a segment).
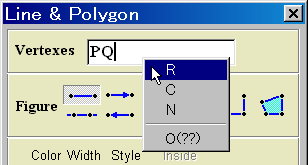
- Add the vertexes by right clicking on the vertex part.
Of course, you can input from the keyboard.
You have to have three points for an angle.
- Select angle, line graph, or polygon.
- You can choose the interior color for the angle and the polygon.


