Graph of a parametric curve
GRAPES draws graphs of parametrics curves of the form x = f (t) and y = g (t).
New curve
 Pointing the cursor on the button [Draw] in the Curve Area on the Data Panel, the available names for curve are suggested, select one of them.
- The Properties window will appear. Input information as explained in the following.
Edit and Delete
-
In the Curve Area, click the expression you want to edit or delete.
The Properties window will appear. Edit as explained in the following.
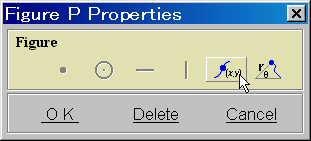
 Select the curve type
- The parametric curve and the polar equation are available.
- In the example below, we have selected the [Parametric Curve].
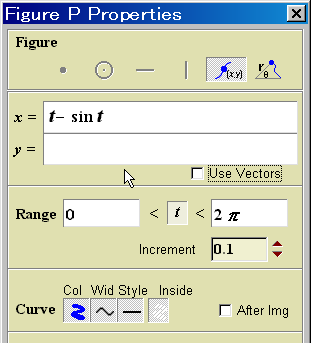
 Input expressions (values)
- By clicking the right side of "x =", the calculator will appear,
then input your expression.
All the parameters available in GRAPES are also available here.
- Input also an expression for "y =".
- If "x" or "y" is used in an expression, it means the abscissa and the ordinate of the same point. To refer to the components x, y, and r of any points,
input "Ax", "Ay", "Ar", etc.
"y1" ... "y9" are not available.
Parameter and its range
- Select a parameter.
The default parameter is "t", but you can select other parameter by putting the cursor on "t".
- Input from the calculator the upper and lower bounds of parameter range.
The value can be indicated by an expression.
- Set the increment of parameter.
Setting a small value makes drawing more precise.
Set a value less than 3000 on "(upper bound - lower bound)/increment"
Graph style
- Select the color, the thickness, the line type, On/Off of the after image, and On/Off of the label.
The default color of interior part is transparent.
You can fill the interior part by changing the default.
- Click [OK], when you finish.
Point
- To explain that the graph of parametric curve is drawn by moving point,
GRAPES can show it by a moving point on the parametric curve.
Therefore, the curve will be shown even with transparent point.
- The point is shown according to the parameter values indicated in the Parameter Area.
Label
- Point and Line can be drawn and can be named (label).
- A descriptive text can be added to the label by inputting it in the text box, this text will be displayed on the screen.
- The label can, like Note, show an expression and its value.
But, the phrases for some lines and the color change are not available.
- The font size can be changed in the [Scale Options].
 Pointing the cursor on the button [Draw] in the Curve Area on the Data Panel, the available names for curve are suggested, select one of them.
 Pointing the cursor on the button [Draw] in the Curve Area on the Data Panel, the available names for curve are suggested, select one of them.
 Select the curve type
 Input expressions (values)